Tuesday, November 14, 2017


Screen Shot 2017-10-01 at 10.49.40 AM.png

Using ThingLink to Explore Threatened Wetlands (Wetland Restoration)
Wetland protection and restoration are key factors in preventing this threatened habitat from destruction.

As more communities and developments branch out into undeveloped lands, we encounter habitats that are often overlooked as important to the stability of our ecosystems.  Unfortunately, freshwater wetland habitats typically fall into this category, as they are often simply referred to as “swamps.”  Most people do not have a positive reaction when they hear the word “swamp.” Instead, they think stagnant stinky water.  In reality, freshwater wetlands are vital to the stability of our ecosystems because they provide breeding grounds for many creatures such as frogs and turtles.  They also provide a filtration system for our water as it percolates through the soils.  

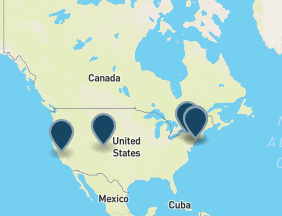
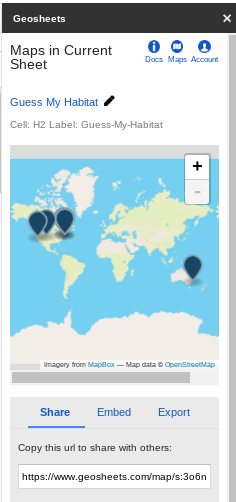
The 360 image used for our ThingLink journey is a picture from a freshwater wetland in New York State.  The image explores many components to a freshwater wetland using images, videos and student engagement tools.  Students will be guided along to answer the question of: “how we can protect and restore wetlands to their native state?”  Students will explore the soils of the wetlands, endangered species, native grasses, water testing parameters and methods used to restore wetlands.  Students will also create a shared google map plotting various wetland regions of New York State.  ThinkLink offers the ability to include links to key Google for Edu tools, as well as popular student engagement tools, such as Padlet to encourage voice and collaboration during the project.  

The ThingLink platform allows for engaging and clean packaging of an interactive unit to learn about freshwater wetlands.  


Bio
Jen Cauthers
Science teacher since 1999 and district technology leader.  My interest in technology started with my MS in Instructional Technology from NYIT.   I am also a Google for Education Certified Trainer and an Apple Certified Teacher.  I have always loved integrated technology in my class starting with using probes for science experiments in the early years to 1:1 chromebooks in the last few years.  Recently, I have found a passion for virtual reality and augmented reality apps now that mobile devices have become so powerful and most students carry them daily.  I love VR and AR use with students because it takes them on journeys that are not normally possible especially within a 42 minute class period.  My main focus with technology integration is to use it for student creation rather than simply consumption of information.   

Brian Cauthers
Middle school science teacher since 2000.  I am Google for Education Certified Trainer and Apple Certified Teacher.  My interest in technology started at an early age growing up in a house with my father who had a computer science master's degree.  When I began teaching, I set up my own network in my classroom with my apple laptop and helped my inner city students stay on the cutting edge as they were part of an engineering/technology house.  In later years, I began to incorporate more web based applications for ease of use with students at home.  I recently became very involved in the applications of virtual reality and augmented reality apps in the classroom.  I began a virtual field trip website for our school district, piloting a 360/VR field trip group in my middle school.  

Sunday, June 11, 2017

Cool New Geo Tool For Google Sheets


Co-authored post from Jen Cauthers and Brian Cauthers about a Geo Tool we found this week!

File:X-office-spreadsheet.svg - Wikimedia CommonsHave ever tried to integrate Google Sheets data with a Google Map (need help with this take a look at this tutorial)?  If you have there is one critical problem with that workflow…  If the data in the sheet is continually being updated you will have to update the map to reflect the current data.  


Well, not anymore! While attempting to figure out the easiest way to do a collaborative map for a class that we are taking through EdTechTeam, we found a new add-on to sheets called Geosheets!  This add-on will allow your spreadsheet data to be automatically updated to reflect real time data entry into your map.  Game changer!  Before Geosheets, auto-updating a map required a bit of programming knowledge and was just a hassle for most of us.


Geosheets at its basic level will allow you to create custom maps with simple equations in your spreadsheet.
 It will allow you to create a Google Form and when the form data is updated in the sheet, Geosheets will allow the automatic update of the map.
Some of the advanced functions in the classroom will be to create all sorts of custom maps to illustrate human impacts on global temperature, urban heat sinks, travel maps, major weather event mapping, historic events.  All of these maps will allow you to customize the map with colors, lines, and interactive features such as attaching links, pictures, and videos.

The website for Geosheets contains examples for each of the functions and tutorials on how to create maps with your data.  There is even a set of demo data for you to experiment with prior to using your own data.

Getting Started
  • Install the Add-On in Google Sheets
  • Activate Geosheets in your spreadsheet

        
  • Authenticate/link your google account.
  •   

  • Create a spreadsheet with at least one column containing locations to be mapped
    (or gather your data using a Google Form):
  • Location info can be in the following formats:
    • City, State
    • Address
    • Landmark
    • Latitude, Longitude (decimals or degree minute second values)
  • Additional information to include in your spreadsheet for mapping
  • Label - label for the pin to place on the map
  • Color: A color name or hex code (e.g. #ececec) for the marker representing the given location.
  • Icon: The name of an icon to render within the marker for a given location. Allowed names are any from https://www.mapbox.com/maki-icons/, e.g. "lodging" or "rail".
  • Type: The type of the feature in this row, one of marker, circle, line, geodesic. If omitted the row is assumed to be a marker.
  • Radius: If the feature type is circle, the radius in pixels.
  • Image: The url of an image to show in the infowindow when clicking on a feature.
  • Any other attribute you add into a column will be added to the popup window when you click on the pin for that location.
If you are going to include additional information besides location, you need to include a header row with labels.

This is just the very basic type of map placing a pin at a location on the map with some labels, different pin types, colors, etc.   Geosheets is much more powerful for mapping than any other tool I have seen.  You can also create maps that will use your data and lookup information based on the values or assign values for mapping based on the data provided.
Examples:
  • Lookup latitude, longitude values for a location
  • Heatmap: creates a heatmap from the locations and assigns intensities based on the data
    • =GEO_HEATMAP(locations:range, label)
  • Color: color codes pins - you can provide your own color or Geosheets helper functions can assign colors
Generates distinct colors for each unique value in a column. Use this when you're trying to color-code discrete values like strings.

To see samples of the main types of maps you can create with Geosheets with their interactive features, please visit their sample page here.  

For our class, we wanted students to collect data from others around the world about the plants and animals living in their habitat so that our classes could guess what type of habitat they live in. We created a form here to collect the data from classes around the world with the data and also a picture of the habitat and called it Guess the Habitat.

The data is sent to a Google Sheet where we use the Add-On to create a map.  The questions in the form drive the labels for the columns so that the formula to create the map is quick.  For our example, we collected:
  • Location
  • Flora: plants found in the habitat
  • Fauna: animal found in the habitat
  • Image:  URL for a picture of the habitat
  • Email: so we can collaborate with the respondents

Here’s a set of sample data:

Once you have at least a shell for your data, you need to enter the formula to create your map.

The Add-On helps you to build your formula.  


In a cell in your spreadsheet, start typing the beginning of your formula:
=Geo_Map(range, “title”)

  • Range - range of cells for your data or column - you can click and drag in your sheet
  • Title - title for your map

You will get a preview of your map on the right side of your sheet and a link will be inserted into the cell that you can copy and paste into an email, website, etc. or you can get an embed code.  Here’s a sample map for our project.  

The one downside of the Geosheets is that in the free version you are only able to have 5 active maps and 200 responses per day.  For most of us, this is plenty.  For high end users, you would need a paid plan, which is $19.99/month which is too costly for educational use.

Overall, this is an amazing tool to create fully interactive maps that update in real time as data is collected.  We are so excited to use the tool in our classes next year.  We would love to hear how you use it in your classes too.

Thanks for learning with us.

Jen Cauthers and Brian Cauthers


Monday, June 5, 2017

Zspace Mobile Learning Lab

ZSpace VR/AR Mobile Learning Lab visits Mahopac!

Have you heard of zSpace?  

If not, you are definitely missing out on an amazing experience!  


Today (6/2/2017), the zSpace VR/AR demo mobile learning lab visited our middle school and high school.  We first learned about zSpace on the web and then saw a demo of it at one of our BOCES technology expos last year.  However, we did not explore the idea further due to time constraints.  Luckily, our technology department was able to secure a demo for us last week! 

The topics that zSpace offers is expanding tremendously into areas such as geography and math.    If you search their database of lessons, there are over 100 lessons for middle school science topics.  If you teach a class that covers the human body or animal models, you will be astounded at what zSpace can do.  Imagine being able to extract the blood vessels from the human brain.  Or how about being able to take apart sections of the heart?  You can do that in zSpace with ease.

When you book zSpace to come to your school for a demo, they bring a giant mobile learning lab with all of the equipment needed for your experience. The staff oriented the students to the tools for the platform and they were off and running within about 10 minutes.  Our groups explored some of the human body systems.  The images were dynamic, realistic and even had a quiz feature.  The students were amazed at how much they could magnify an image, see details, and explore from every angle.  The glasses allow you to see the content in a 3D or augmented reality manner.  The glasses were much more natural feeling than a typical virtual reality headset that can sometimes get very hot and foggy. 

We know that the content is high level, but we were holding out on the feedback from the students. Since our group ranged from 8th graders to 12th graders, we knew if would be a good sampling.  The seniors were more skeptical.  They haven't grown up using technology in their classes, so they aren't used to it invading their classrooms.  Believe it or not, they still like paper and pen.  Afterwards, they commented that they really liked the zSpace experience to be able to get a more realistic look at the human body to prepare for dissections.  It is something they could do "once in a while, but not every day."  Perfect.  They realize that everything in moderation is a good mix.  The students still want the experience of a real dissection, not just a virtual one, but know that the virtual dissection prepares them for the real thing. 

The younger students really thought the experience was helpful to see things that they normally have difficulty viewing or testing in real life.  We also had one group of 8th graders that were able to spend about an hour in the van.  This group experienced building a circuit for a quad copter.  It was a challenge to see which team could build it the fastest and they loved it. The team work was great because the "passenger" truly helped the "driver" troubleshoot the system.  It was amazing to see how this group learned how to manage the system by the end of their hour and saw their skill level increase to a visible comfort level navigating the tools.  At the end, some students did comment that an hour was a bit tiring on their eyes but it was very fun.  

 One of the highlights of the day showed just how intuitive the software is once the students get a little time to practice. After only ten minutes using the software, one of our students showed her teacher how to explore with zSpace.  Watch the video to the right to see it in action.


The zSpace trainer asked the students one question at the end of the hour, "if you could describe zSpace in one word, what would it be?"  One student shouted out immediately, "revolutionary!"  Well said.  If implemented thoughtfully, zSpace can be a game changer in your classroom.  Students can experience and experiment with tools that are not easily used in the traditional classroom setting.  It brings content that would normally be inaccessible to everyone. 

Check out our photos and videos from the day!  Hope you enjoy.

-Jennifer and Brian Cauthers

Wednesday, September 28, 2016

Google Cast, a whiteboard, and a chromebook....


I have been researching and experimenting with ways to utilize my teacher chromebook with my 
interactive whiteboard and this seems to be an option that works really well for me.

Install Google Cast for Education on your teacher workstation that is connected to your whiteboard.

https://chrome.google.com/webstore/detail/google-cast-for-education/bnmgbcehmiinmmlmepibeeflglhbhlea?hl=en-US
Make sure that when you go to use cast that you login to chrome on your desktop (click the little silhouette 
icon in the upper right hand corner of the browser window).  This will allow all of your chrome extensions to 
load on your desktop.  Now just launch google cast for education and setup the cast window.
Cast video tutorial (https://www.youtube.com/watch?v=nzTD4l_G5nc)

To cast your chromebook screen to the desktop.  Open chrome on your chromebook and click the 3 dots next to 

your chrome extensions bar and scroll down to cast.  Select the device (whatever you named the desktop) and 
select what you want to cast (desktop---your entire chromebook screen or tab---just the tab you are in).


To have your mobile whiteboard...

I installed realtimeboard (app in the chrome webstore)

https://chrome.google.com/webstore/detail/realtimeboard-whiteboard/opfmbdmhambgleempeofcjjhjclimccg

I use this whiteboard tool because it allows me to export whatever I write on the "mobile whiteboard" to drive!

Once you start the app you now have a "mobile whiteboard" for your room.
Tutorial for realtimeboard and GAFE integration
https://realtimeboard.com/landing/google-drive/

Advanced uses of google cast.

If you are using chromebooks in class you can:
1)have students cast their screens to the class whiteboard to review their work/answers with the class.
2)short presentations of lab findings, writings, presentations and any other digitally created work the
 students would like to showcase in class.

I have also used a mind mapping tool

Coogle https://chrome.google.com/webstore/detail/coggle-collaborative-mind/hbcapocoafbfccjgdgammadkndakcfoi
for collaborative mind mapping and google cast on my class whiteboard and it works great as a brainstorming 
or even a review activity.

Hope this tutorial helps

Brian

Wednesday, September 21, 2016

Google Expeditions and more trip ideas!

I just thought that I would pass along some new updates from google (easy to use with BYOD).  Google just released google expeditions on the iOS platform!  What does that mean for us…  We can now access google expeditions in our classes and utilize our student’s devices (almost all of my students have an iPhone) to take guided virtual field trips around the world!  If you cannot find an appropriate destination in the expeditions library you can use google street view app and create a virtual field of your own (minus the guide).  I have used google expeditions and google street view in various settings with google cardboard and it is an awesome experience for students and teachers.
Check out expeditions (I know the about page says only in google play but search in itunes and you will find expeditions) and google street view

Google Maps is another great option for many as it is completely customizable by individual students or collaboratively.  Pins can be added to any location and those pins can be edited to add photos, links, etc to each pin.  My maps can also be integrated with sheets via a google form.  I discussed this briefly in my training session on Supt Conf day and have had several inquiries about the video I attached to the presentation (see below)

Last Google tip…
If you want to force your students to make a copy of a document or presentation just replace edit in the url address bar with copy or present (forces into presentation mode for slides)
https://docs.google.com/document/d/1c9U11LPfw3P_5waTm5xfFRtXhangJQmEqV8xB2fFElM/edit and replace with
https://docs.google.com/document/d/1c9U11LPfw3P_5waTm5xfFRtXhangJQmEqV8xB2fFElM/copy

This also works in slides for presentation mode just replace edit with present.

Hope you can use some of this in your classes.

Thursday, August 4, 2016

Foreign Language Virtual Reality Ideas...

I have been exploring ways to assist Foreign Language teachers integrate Virtual Reality and/or Augmented Reality into their classes.  They are looking to make an immersive virtual foreign language experience for their students.  They have experimented with Google translate AR with minimal success.  Any ideas would be appreciated!

Tuesday, August 2, 2016

Tilt Brush

Tilt Brush Demo
I just came across this app from Google and it appears to be an extraordinary experience for teachers and students.  What are the experiences of those that have used this in a classroom experience (i.e. ease of use, stability, etc)?  Are there any other VR drawing tools out there that utilize non-specific VR headsets (Tilt Brush req HTC Vive)?