Co-authored post from Jen Cauthers and Brian Cauthers about a Geo Tool we found this week!
 Have ever tried to integrate Google Sheets data with a Google Map (need help with this take a look at this tutorial)? If you have there is one critical problem with that workflow… If the data in the sheet is continually being updated you will have to update the map to reflect the current data.
Have ever tried to integrate Google Sheets data with a Google Map (need help with this take a look at this tutorial)? If you have there is one critical problem with that workflow… If the data in the sheet is continually being updated you will have to update the map to reflect the current data. 
Well, not anymore! While attempting to figure out the easiest way to do a collaborative map for a class that we are taking through EdTechTeam, we found a new add-on to sheets called Geosheets! This add-on will allow your spreadsheet data to be automatically updated to reflect real time data entry into your map. Game changer! Before Geosheets, auto-updating a map required a bit of programming knowledge and was just a hassle for most of us.
Geosheets at its basic level will allow you to create custom maps with simple equations in your spreadsheet.
It will allow you to create a Google Form and when the form data is updated in the sheet, Geosheets will allow the automatic update of the map.
Some of the advanced functions in the classroom will be to create all sorts of custom maps to illustrate human impacts on global temperature, urban heat sinks, travel maps, major weather event mapping, historic events. All of these maps will allow you to customize the map with colors, lines, and interactive features such as attaching links, pictures, and videos.
The website for Geosheets contains examples for each of the functions and tutorials on how to create maps with your data. There is even a set of demo data for you to experiment with prior to using your own data.
Getting Started
-
Install the Add-On in Google Sheets
-
Activate Geosheets in your spreadsheet
-
Authenticate/link your google account.
-
Create a spreadsheet with at least one column containing locations to be mapped
(or gather your data using a Google Form):
-
Location info can be in the following formats:
-
City, State
-
Address
-
Landmark
-
Latitude, Longitude (decimals or degree minute second values)
-
Additional information to include in your spreadsheet for mapping
-
Label - label for the pin to place on the map
-
Color: A color name or hex code (e.g. #ececec) for the marker representing the given location.
-
Icon: The name of an icon to render within the marker for a given location. Allowed names are any from https://www.mapbox.com/maki-icons/, e.g. "lodging" or "rail".
-
Type: The type of the feature in this row, one of marker, circle, line, geodesic. If omitted the row is assumed to be a marker.
-
Radius: If the feature type is circle, the radius in pixels.
-
Image: The url of an image to show in the infowindow when clicking on a feature.
-
Any other attribute you add into a column will be added to the popup window when you click on the pin for that location.
If you are going to include additional information besides location, you need to include a header row with labels.
This is just the very basic type of map placing a pin at a location on the map with some labels, different pin types, colors, etc. Geosheets is much more powerful for mapping than any other tool I have seen. You can also create maps that will use your data and lookup information based on the values or assign values for mapping based on the data provided.
Examples:
-
Lookup latitude, longitude values for a location
-
Heatmap: creates a heatmap from the locations and assigns intensities based on the data
-
=GEO_HEATMAP(locations:range, label)
-
Color: color codes pins - you can provide your own color or Geosheets helper functions can assign colors

Generates distinct colors for each unique value in a column. Use this when you're trying to color-code discrete values like strings.
To see samples of the main types of maps you can create with Geosheets with their interactive features, please visit their sample page here.
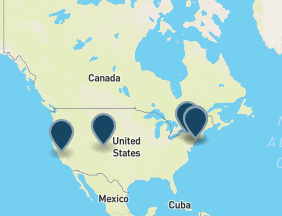
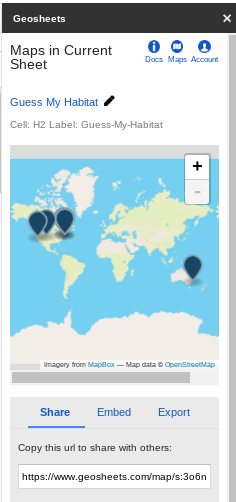
For our class, we wanted students to collect data from others around the world about the plants and animals living in their habitat so that our classes could guess what type of habitat they live in. We created a form here to collect the data from classes around the world with the data and also a picture of the habitat and called it Guess the Habitat.
The data is sent to a Google Sheet where we use the Add-On to create a map. The questions in the form drive the labels for the columns so that the formula to create the map is quick. For our example, we collected:
-
Location
-
Flora: plants found in the habitat
-
Fauna: animal found in the habitat
-
Image: URL for a picture of the habitat
-
Email: so we can collaborate with the respondents
Here’s a set of sample data:

Once you have at least a shell for your data, you need to enter the formula to create your map.
The Add-On helps you to build your formula.
In a cell in your spreadsheet, start typing the beginning of your formula:
=Geo_Map(range, “title”)
-
Range - range of cells for your data or column - you can click and drag in your sheet
-
Title - title for your map
You will get a preview of your map on the right side of your sheet and a link will be inserted into the cell that you can copy and paste into an email, website, etc. or you can get an embed code. Here’s a sample map for our project.
The one downside of the Geosheets is that in the free version you are only able to have 5 active maps and 200 responses per day. For most of us, this is plenty. For high end users, you would need a paid plan, which is $19.99/month which is too costly for educational use.
Overall, this is an amazing tool to create fully interactive maps that update in real time as data is collected. We are so excited to use the tool in our classes next year. We would love to hear how you use it in your classes too.
Thanks for learning with us.
Jen Cauthers and Brian Cauthers
Thanks for learning with us.
Jen Cauthers and Brian Cauthers
